Castle Rock Homes Colorado
Whether your home search is focused on a low-maintenance condominium or townhome, a roomy single-family home, or a luxurious custom residence, Castle Rock should be a top contender among the south metro communities.
Castle Rock, located in Douglas County, holds an impressive fourth rank in Quality of Life and Best Place to Live, according to Money Magazine. The city, named after a castle-like butte visible from miles away, offers stunning vistas. Festival Park, a local hotspot, features a landing pavilion, splash pad, fire pits, ample open space, picnic areas, and more. The 320-acre Phillip S. Miller Park is a recreational paradise, boasting batting cages, swimming pools, diverse trails, and a year-round snow sports complex.
The city also caters to foodies and beer lovers, hosting several breweries and restaurants. Within the Castle Pines North community, residents enjoy a range of homes nestled in well-planned neighborhoods, offering a lifestyle that ranks among Colorado's most inviting. The community boasts beautiful tree-lined streets, 352 acres of open space, and 14 miles of trails. Elk Ridge Park and the Rueter-Hess Reservoir, situated within the community, add to its charm.
List of Zipcodes in Castle Rock Homes Colorado
| Zip Code | Zip Code Name | Zip Code Population |
|---|---|---|
| 80104 | Castle Rock | 34,010 |
| 80105 | Deer Trail | 1,601 |
| 80109 | Castle Rock | 28,767 |
Source: Census Bureau
Demographics
State
Colorado
County
Douglas County
City
Castle Rock
Population
69,290
| Zip Code | City | County | State | National | |
|---|---|---|---|---|---|
| Population | 34,010 | 69,290 | 351,154 | 5,759,582 | 331,426,769 |
| Population Density | 438.4 | 2,023.5 | 1,167.0 | 55.5 | 93.8 |
| Percent Male | 49.0% | 50.0% | 50.0% | 49.0% | 49.0% |
| Percent Female | 51.0% | 50.0% | 50.0% | 51.0% | 51.0% |
| Median Age | 39.4 | 37.7 | 41.0 | 40.2 | 39.0 |
| People per Household | 2.8 | 2.9 | 2.9 | 2.8 | 2.6 |
| Median Household Income | $97,062 | $104,759 | $114,156 | $115,942 | $61,963 |
| Average Income per Capital | $41,442 | $43,037 | $61,155 | $50,725 | $33,235 |
Source: Census Bureau
Market Data
| Zip Code | City | County | State | National | |
|---|---|---|---|---|---|
| Median Sale Price | $498,500 | $490,750 | $550,500 | $425,100 | $277,796 |
| Median Age of Home | 32.0 | 29.0 | 33.0 | 39.0 | 49.0 |
| Homes Owned | 73.0% | 75.0% | 77.0% | 67.0% | 58.0% |
| Homes Rented | 21.0% | 21.0% | 18.0% | 23.0% | 31.0% |
| Homes Vacant | 5.0% | 5.0% | 4.0% | 4.0% | 11.0% |
Sources: Census Bureau / Homendo
Source: REcolorado
This free service is provided by your local Agent
How much is your Home worth? Click here to know...
Review current market value estimates for your home, or anyone else, anywhere in the USA.
9040 properties on market in Castle Rock Homes Colorado
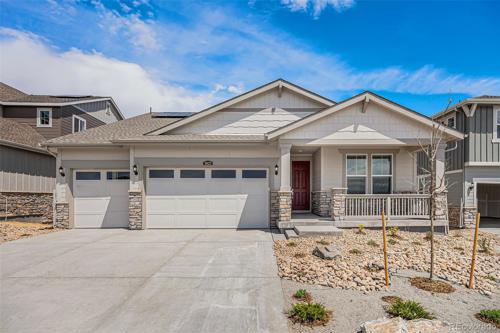 Pending
Residential
MLS# 9528702 | 2024-07-27T14:19:16.166Z
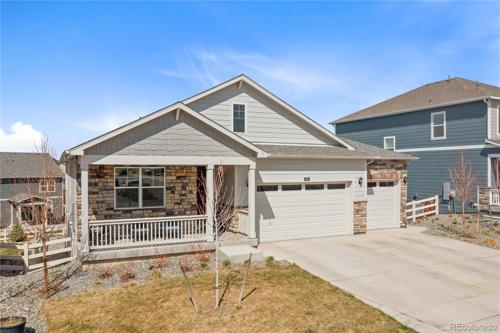 Pending
Residential
MLS# 4319000 | 2024-07-27T13:41:16.237Z
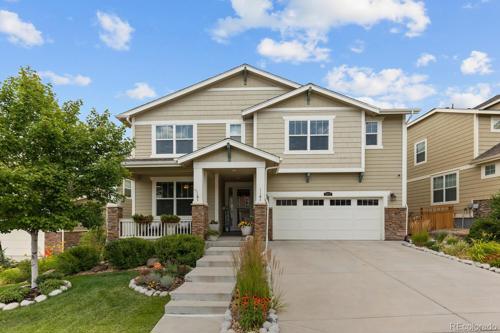 Active
Residential
MLS# 7827780 | 2024-07-27T13:18:16.203Z
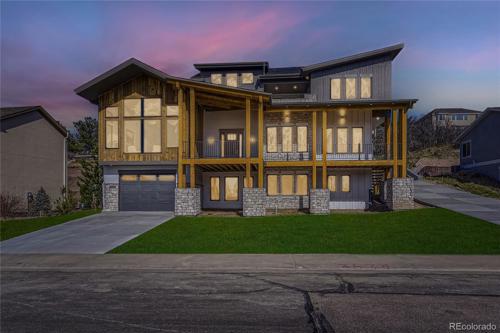 Active
Residential
MLS# 9579852 | 2024-07-27T13:09:16.426Z
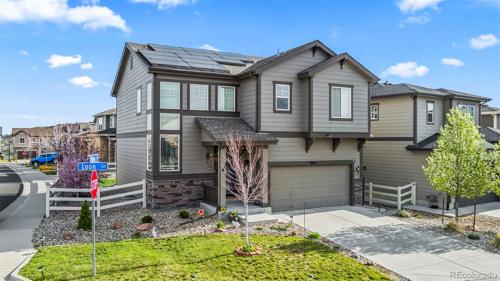 Active
Residential
MLS# 9021492 | 2024-07-27T13:04:16.293Z
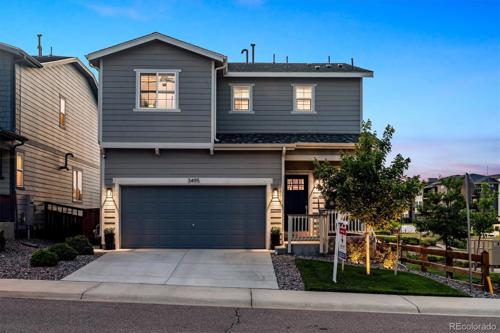 Active
Residential
MLS# 5544763 | 2024-07-27T07:36:16.345Z
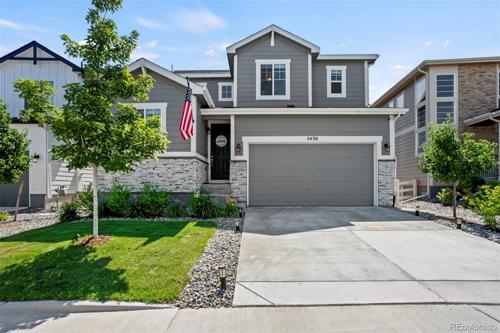 Active
Residential
MLS# 3461155 | 2024-07-27T07:15:17.465Z
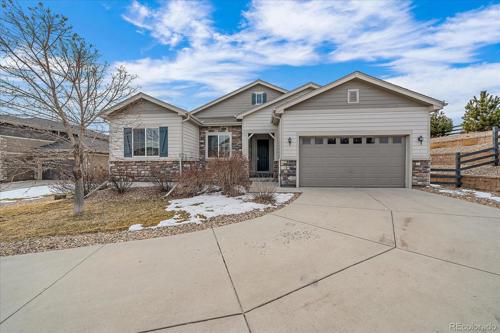 Expired
Residential
MLS# 3589475 | 2024-07-27T06:11:17.257Z
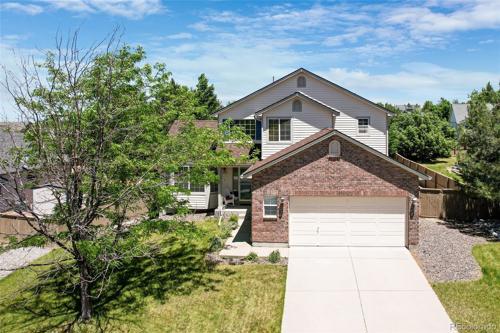 Sold
Residential
MLS# 7669206 | 2024-07-27T05:04:16.158Z
This free service is provided by your local Agent
Need more listings? Click here to search now...
15 minutes updated and accurate properties direct from your local agent. Home Evaluation. Get Loan Pre-Qualified.
Vicki Mahan
RE/MAX Professionals
6020 Greenwood Plaza Boulevard
Greenwood Village, CO 80111, USA
6020 Greenwood Plaza Boulevard
Greenwood Village, CO 80111, USA
- (303) 641-4444 (Office Direct)
- (303) 641-4444 (Mobile)
- Invitation Code: vickimahan
- Vicki@VickiMahan.com
- https://VickiMahan.com
Contact Me
Valuation Index
- Quality of Life
- Climate & Environment
- Schools & Education
- Safety & Crime
- 90%
- 81%
- 81%
- 19%
Source: Homendo
Quality of Life
Cost of Living
109.0
Health Cost Index
119.0
Commute Time
28.0
Working from Home
6.0%
| Zip Code | City | County | State | National | |
|---|---|---|---|---|---|
| Cost of Living Index | 109.0 | 116.0 | 116.0 | 110.0 | 100.0 |
| Health Cost Index | 119.0 | 125.0 | 124.0 | 119.0 | 100.0 |
| Commute Time | 28.0 | 28.0 | 27.0 | 25.0 | 24.8 |
| Commuting by Bus | 1.0% | 1.0% | 2.0% | 1.2% | 2.1% |
| Commuting by Carpool | 10.0% | 10.0% | 8.0% | 11.0% | 13.5% |
| Commuting by Auto | 83.0% | 83.0% | 83.0% | 80.0% | 79.1% |
| Working at Home | 6.0% | 7.0% | 7.0% | 5.2% | 4.7% |
Source: Census Bureau
Walk Score®
Source: Walk Score®
Climate & Environment
January Average Low Temperature
13.6 °F
July Average High Temperature
84.0 °F
Annual Precipitation (inch)
17 inches
| Zip Code | City | County | State | National | |
|---|---|---|---|---|---|
| January Average Low Temperature | 13.6 °F | 13.6 °F | 15.9 °F | 13.7 °F | 22.6 °F |
| July Average High Temperature | 84.0 °F | 84.0 °F | 89.5 °F | 77.5 °F | 86.1 °F |
| Annual Precipitation (inch) | 17 in. | 17 in. | 18 in. | 19 in. | 38 in. |
Source: NOAA Climate
Schools & Education
Source: Great Schools
Safety & Crime
Violent Crimes
271.3
Property Crimes
1,213.5
| Zip Code | City | County | State | National | |
|---|---|---|---|---|---|
Violent CrimesCalculated annually per 100,000 residents |
|||||
| Assault | 140.4 | 146.3 | 69.5 | 246.3 | 250.2 |
| Murder | 2.2 | 2.2 | 2.2 | 3.8 | 5.0 |
| Rape | 68 | 67.9 | 33.6 | 67.2 | 42.6 |
| Robbery | 60.7 | 57.3 | 19.2 | 63.6 | 81.6 |
Property CrimesCalculated annually per 100,000 residents |
|||||
| Burglary | 221.2 | 204.5 | 230.1 | 348.4 | 340.5 |
| Theft | 391.3 | 763.7 | 1,794.6 | 1,858.3 | 1,549.5 |
| Motor Vehicle Theft | 601.0 | 601.2 | 88.7 | 384.0 | 219.9 |
Source: FBI - Crime Data Explorer


 Menu
Menu


